Summary
Ever looked at a crypto chart and thought, “What am I looking at?” You’re not alone. Crypto charts can look intimidating at first, but they’re actually one of the most powerful tools you can use as a trader or investor.
Let’s break it all down into simple steps—no jargon, no confusion.

❓ What Is a Crypto Chart?
A crypto chart is just a visual way to track how a cryptocurrency’s price moves over time. It helps you see:
- 📈 Whether the price is going up or down
- ⚡ How fast it’s moving
- 🔮 Where it might be heading next
Traders use crypto charts to make smarter buying or selling decisions. If you want to take your trading seriously, reading charts is a skill worth learning.

📋 The Most Common Types of Crypto Charts
1. 🟦 Line Chart
- Very basic and easy to read
- Shows closing prices over time
- Great for beginners
2. 🕯 Candlestick Chart
- Most popular chart type
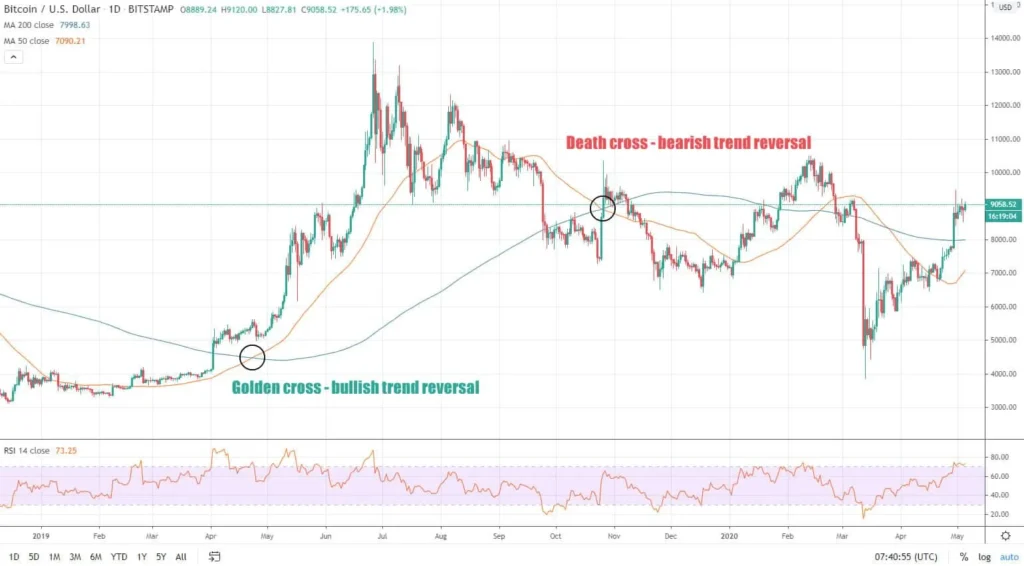
- Each “candle” shows open, close, high, and low prices
- Green = price increase, Red = price drop
3. 📉 Bar Chart
- Similar to candlesticks
- Less visual but still shows essential price data
📝 Tip: If you’re starting out, candlestick charts are the best learning tool.

👀 Key Things to Look At on Crypto Charts
🕒 Timeframe
Choose from minutes to months depending on your strategy.
- Short-term traders: 1min, 5min, hourly
- Long-term holders: daily, weekly
🔊 Volume
Shows how much of a token is being traded.
- High volume = strong market interest
📐 Trend
Is the price going up (📈 bullish) or down (📉 bearish)?
🧱 Support and Resistance
- Support = price level where buyers step in
- Resistance = price level where sellers exit
These zones can help you decide entry and exit points.
🧠 What About Indicators?
Indicators are tools layered on charts to help you analyze movements more clearly.
Popular indicators:
- 📊 RSI (Relative Strength Index) – Detects overbought/oversold signals
- 🧮 Moving Averages (MA) – Smooths out price trends
- 🔁 MACD – Highlights trend reversals
- 🧷 Bollinger Bands – Identifies volatility
🎯 Start with just one or two. Too many indicators can confuse your decision-making.
🧩 Chart Patterns to Recognize
With time, you’ll begin to notice recurring patterns like:
- 🧱 Double Top / Bottom
- 🔼 Triangles
- 🚩 Flags and Pennants
- 👤 Head and Shoulders
Each pattern offers clues about potential price moves.
✅ Pro Tips for Reading Crypto Charts
- 🔍 Keep it clean: avoid overloading your chart
- 👀 Always zoom out for context
- 💡 Look for confirmation signals
- 🧪 Use demo accounts to practice chart-reading skills
🏁 Final Thoughts
Learning to read crypto charts is like unlocking a new skill. It takes a bit of patience, but the reward is real: confidence, control, and clarity in your crypto decisions.
So don’t be intimidated. Grab a chart, start exploring, and soon you’ll be seeing the crypto world in a whole new way. 🚀
Read more: Quarterly Options Expiry Challenges Bitcoin and Ethereum with Over $14 Billion at Risk


