Summary
Pi Network continues to face pressure, with a 61% monthly loss and 12 consecutive days of negative BBTrend, signaling strong bearish momentum.
The RSI has rebounded from the oversold level to 40.45, but remains below the neutral zone, indicating weak buyer confidence.
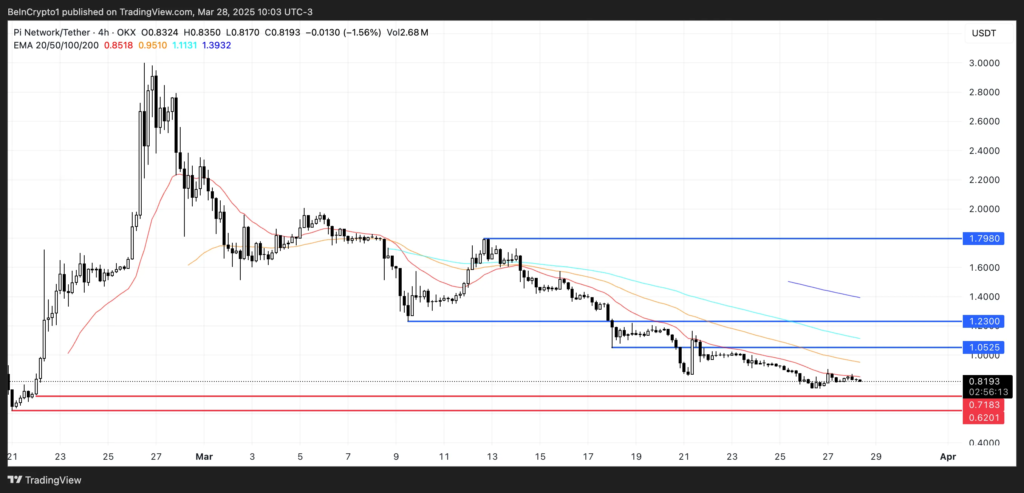
The EMA confirms the ongoing downtrend, with support at $0.718 and resistance at $1.05, shaping PI’s short-term price outlook.
Promo:
Trade on BYDFi for a chance to win exciting rewards like an iPhone 16, Rolex watches, and more!

Pi Network (PI) Faces Strong Selling Pressure with a 61% Price Decline Over the Past 30 Days.Despite its recent partnership with Telegram’s Crypto Wallet, PI continues to struggle in regaining upward momentum, as key technical indicators predominantly signal a bearish trend.
Its BBTrend indicator has remained negative for 12 consecutive days, and while RSI has slightly recovered from oversold levels, it still lingers below the neutral 50 mark. With the downtrend still strong and critical support levels approaching, PI’s next move may depend on whether buyers can step in to reverse the current trend.
PI BBTrend Remains Negative for 12 Days
Pi Network (PI) continues to face downward pressure, as reflected in its BBTrend indicator, which remains deep in the negative zone at -22.34.
This persists despite recent headlines about Telegram’s Crypto Wallet integrating Pi Network, as the news has yet to translate into sustainable bullish momentum.
BBTrend hit a recent low of -41 on March 21, 2025, and has stayed negative since March 16, 2025, marking twelve consecutive days of a bearish trend signal. This prolonged weakness highlights the ongoing struggle of buyers to regain market control.

BBTrend, or Bollinger Band Trend, is a momentum-based indicator that helps assess the strength and direction of a trend. A positive BBTrend value indicates bullish momentum, while a negative value signals bearish sentiment—the farther from zero, the stronger the trend.
With PI’s BBTrend at -22.34, the market remains heavily influenced by a downtrend, even though the recent decline may be slightly easing from its extreme lows.
If this trend does not soon shift into positive territory, PI’s price may remain under pressure, with buyers staying cautious despite the recent integration news.
Pi Network RSI Rebounds from Oversold Territory but Lacks Bullish Momentum
Pi Network is showing early signs of momentum recovery, with its Relative Strength Index (RSI) rising to 40.45, after hitting a low of 23.8 just two days ago.
Although this recovery suggests that excessive selling pressure has eased, PI’s RSI has yet to surpass the neutral 50 level for the past two weeks, highlighting the persistent weakness in bullish confidence.
Despite the slight uptick, the market has yet to display sufficient strength to significantly shift sentiment in favor of buyers. This cautious climb could lead to either a breakout or continued consolidation.

RSI, or Relative Strength Index, is a momentum oscillator that measures the speed and magnitude of price movements. It ranges from 0 to 100, with values above 70 indicating overbought conditions and below 30 signaling oversold assets.
With PI’s RSI currently at 40.45, it sits in the neutral-to-bearish zone—no longer oversold but still lacking strong buying pressure.
For a clearer trend reversal, RSI may need to surpass the 50 level, which has not happened in the past two weeks. Therefore, the current movement appears more like an attempt to form a potential bottom rather than a confirmed trend reversal.
Will PI Continue to Correct?
PI’s price is currently trading in a clear downtrend, as indicated by the alignment of its Exponential Moving Averages (EMA)—where short-term EMAs remain below long-term EMAs.
This structure reflects persistent selling pressure, and if the correction continues, PI could retest key support levels at $0.718, with a potential drop to $0.62 if that support fails to hold.

However, recent signs of recovery in RSI suggest that a short-term rebound may be forming, providing hope for a potential recovery.
If bullish momentum builds up, PI could challenge the resistance level at $1.05 in the short term. A breakout above that level would shift market sentiment and open opportunities for further gains, with potential targets at $1.23 and even $1.79 if the uptrend strengthens.
All information provided on our website is published in good faith and for general informational purposes only. Any actions taken by readers based on the information found on our website should be carefully assessed, and they bear full responsibility for their own decisions and potential risks.
Read more: If you need a product to assist with tax issues and portfolio management in crypto, check out CoinLedger


